Most form tools tell you what people answered
NueForm tells you what happened — before, during and after the answer. Every visit, every hesitation, every drop-off, and who showed up.
A response is the end of a story you never got to read
By the time someone submits, the interesting part is over. Who found the form and left? Which question made them stop? Were they on a phone at 11pm, or a laptop at their desk? Answers alone cannot tell you any of it.
NueForm measures the whole journey — from the moment the page loads to the words in the final box — so a disappointing response count comes with the reason attached.
Five surfaces, one journey
Not a grid of features. These are the stations a respondent passes through, and each one is a place you can see what happened.
They arrived
Every load of your live link, with device, country, referrer and campaign. Repeat visits count — someone returning three times is the signal, not noise.
They stopped
Per-question drop-off and time-per-question show exactly which question is costing you people, and whether they hesitated or bailed.
They answered
Every response carries the visitor behind it: where they came from, what they were using, how long they took.
All at once
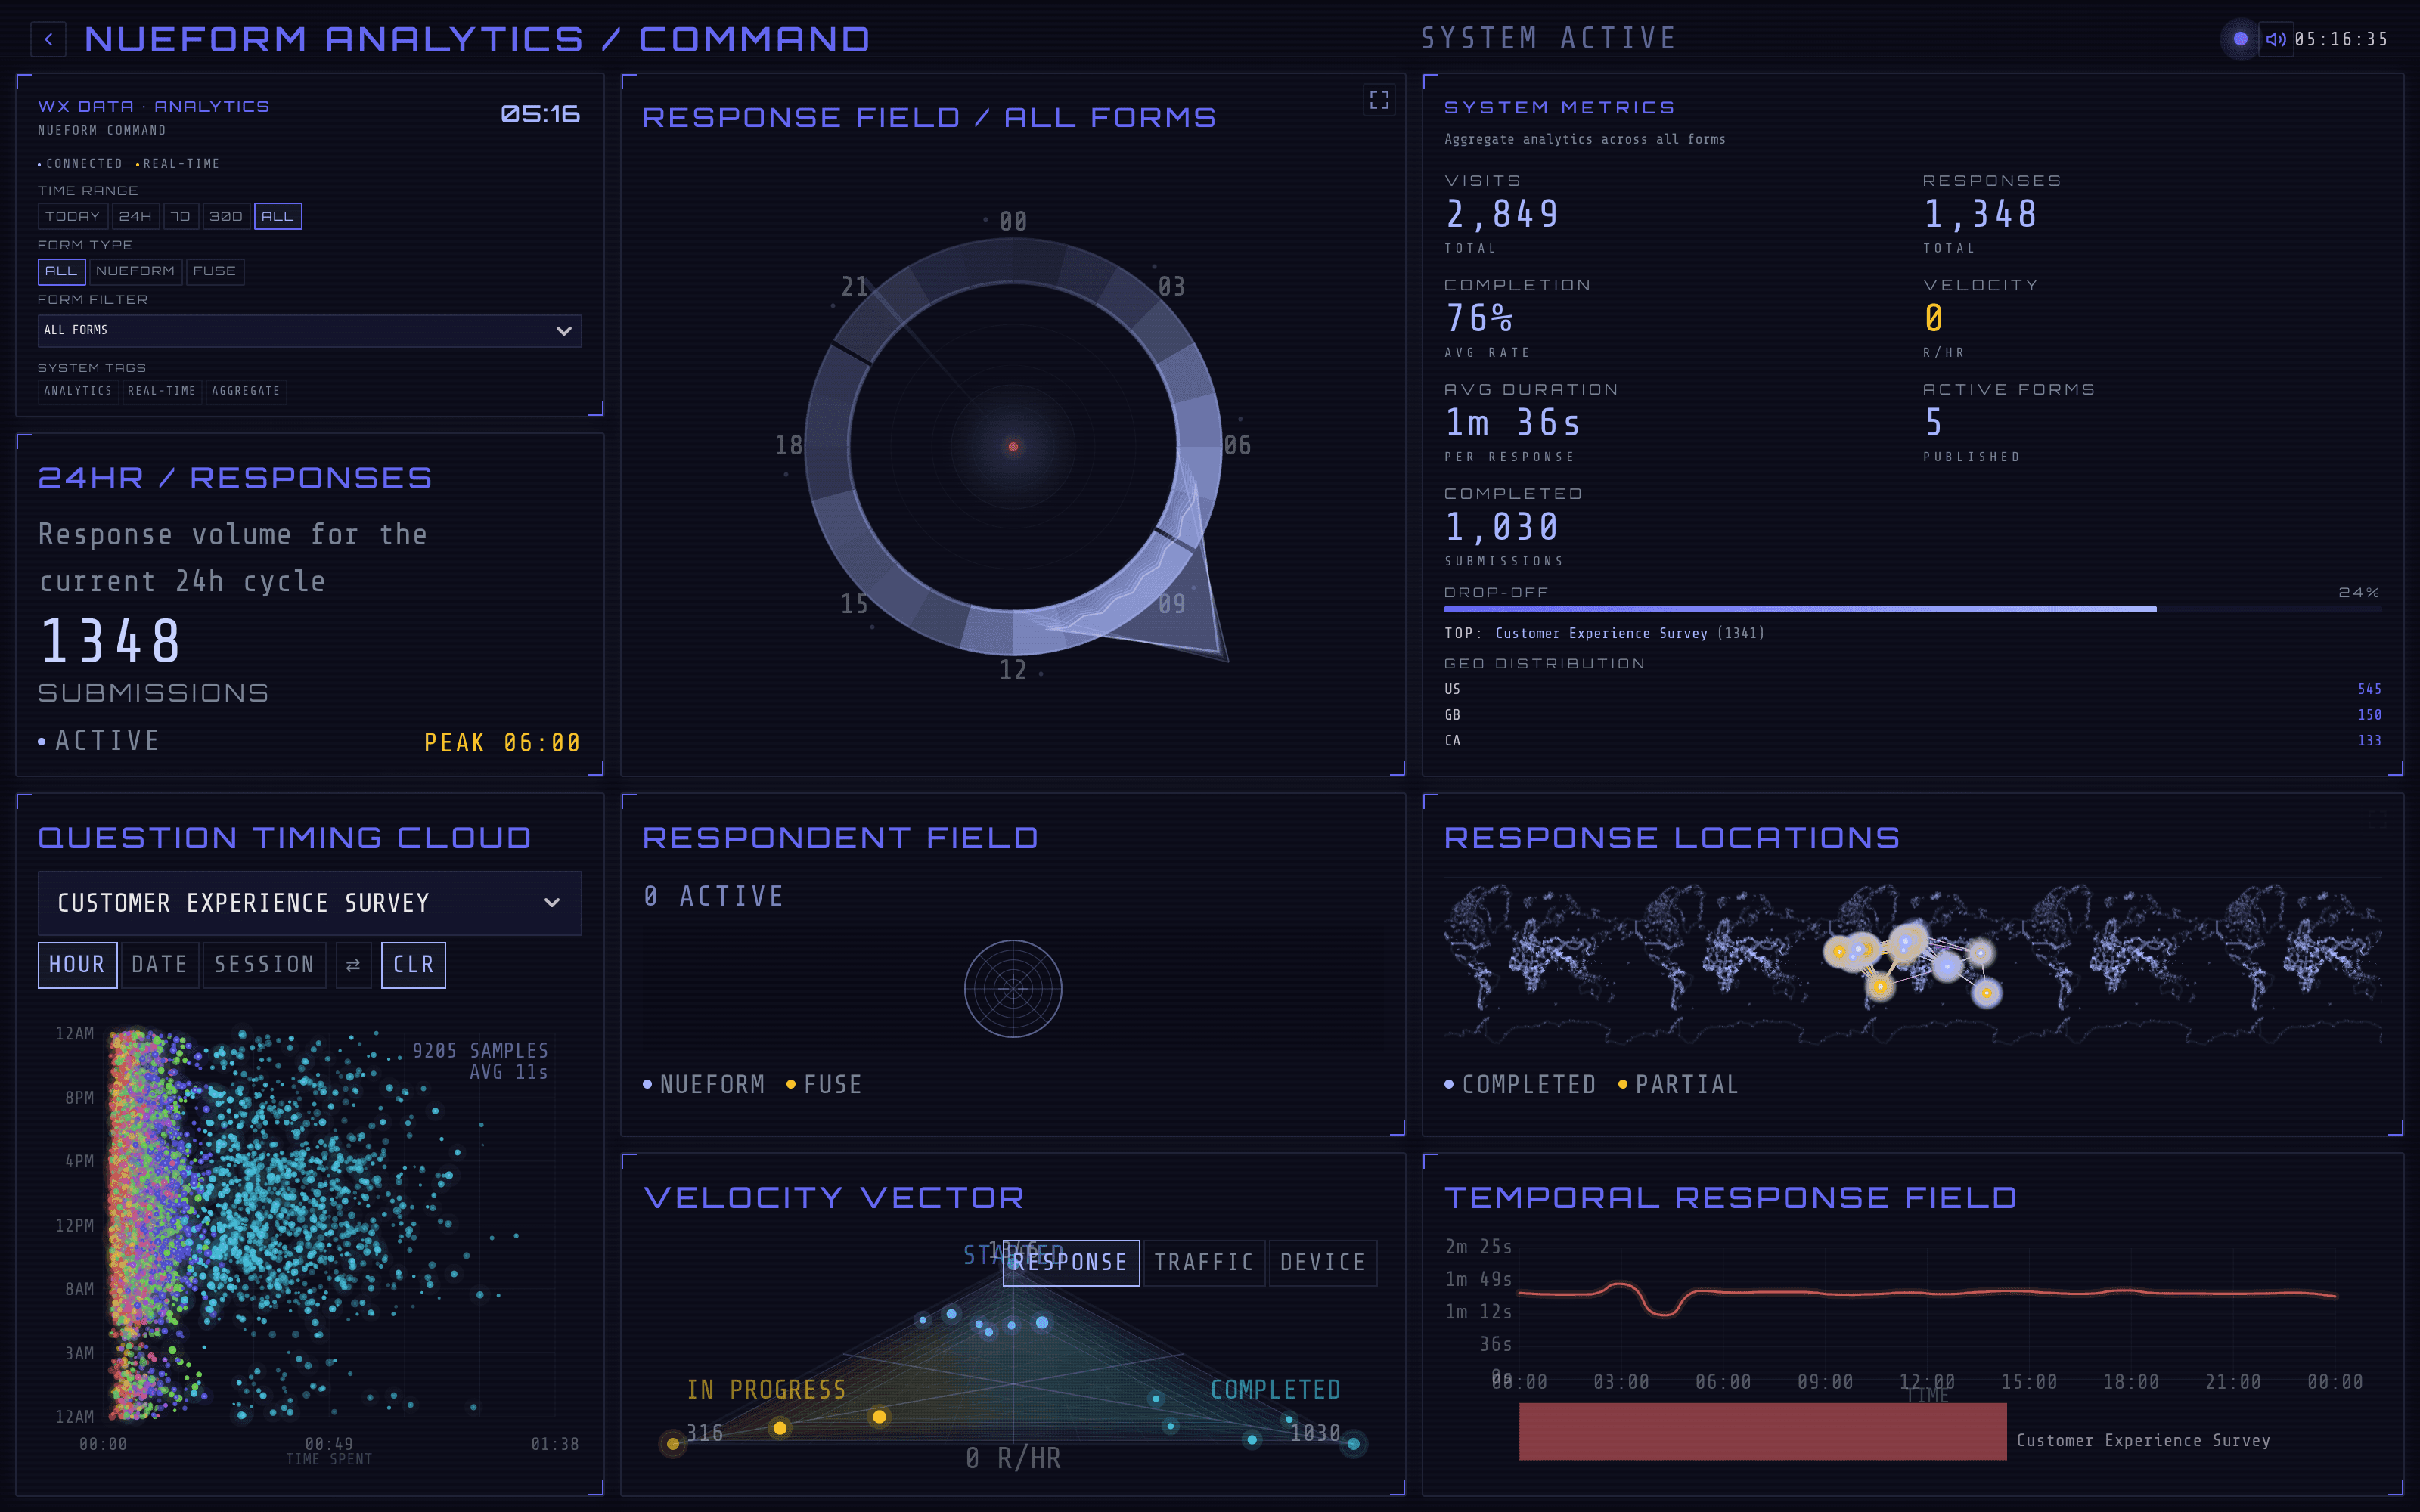
Command Center is the live operational view — active respondents, response locations, velocity, timing, as it happens.
The whole workspace
Fifteen sections across every form you own: traffic, audience, quiz scoring, telephony, sentiment, payments, contracts and more.
Most form tools stop at the answer
Side by side, the difference is not subtle.
Everywhere else
- A response, and the time it arrived
- A completion rate, with no way to know why it moved
- A browser string, if you dig through the raw export
- Nothing whatsoever about the people who left
NueForm
- Every load of the form — not only the ones that ended in a submission
- Visit → start → submit, as three numbers and three curves over one window
- Median and 95th-percentile time on every individual question
- Country, region, device, browser, OS, language, referrer and campaign
- The visitor behind each answer, attached to that answer
- All of it live, and all of it exportable
What you actually get
Six surfaces, shipping today. These are screenshots, not mockups.
Every arrival, with the reason attached
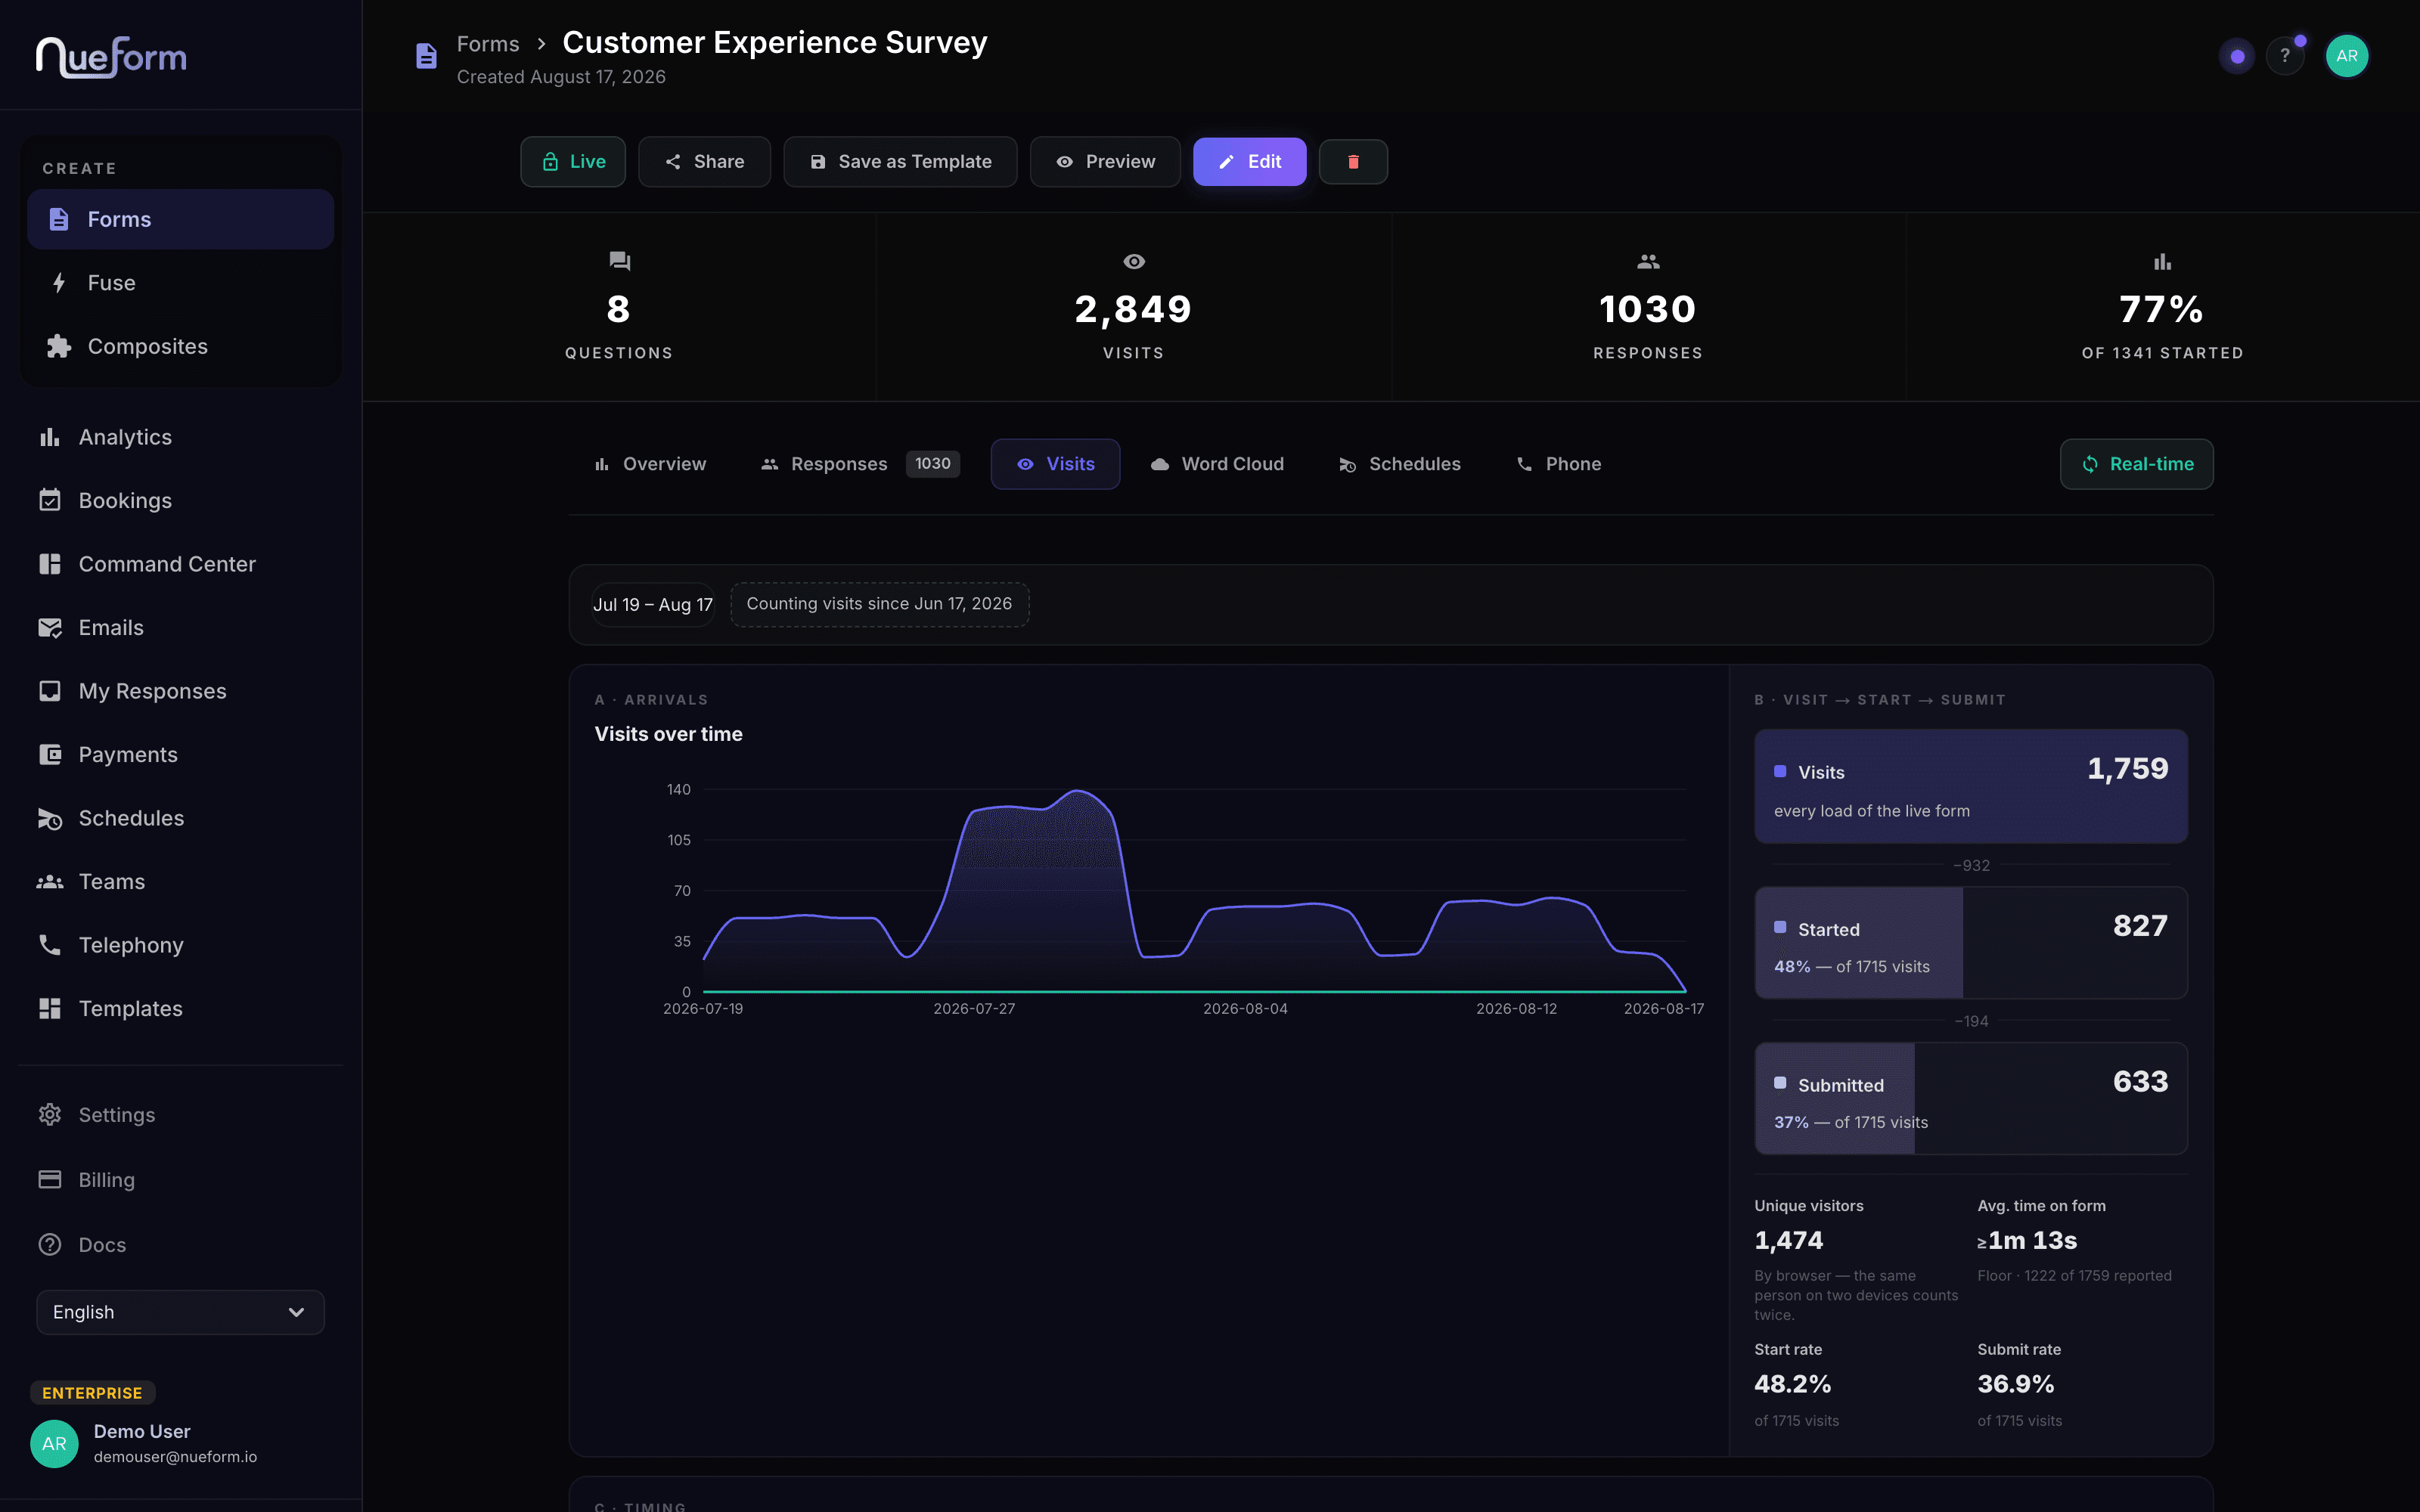
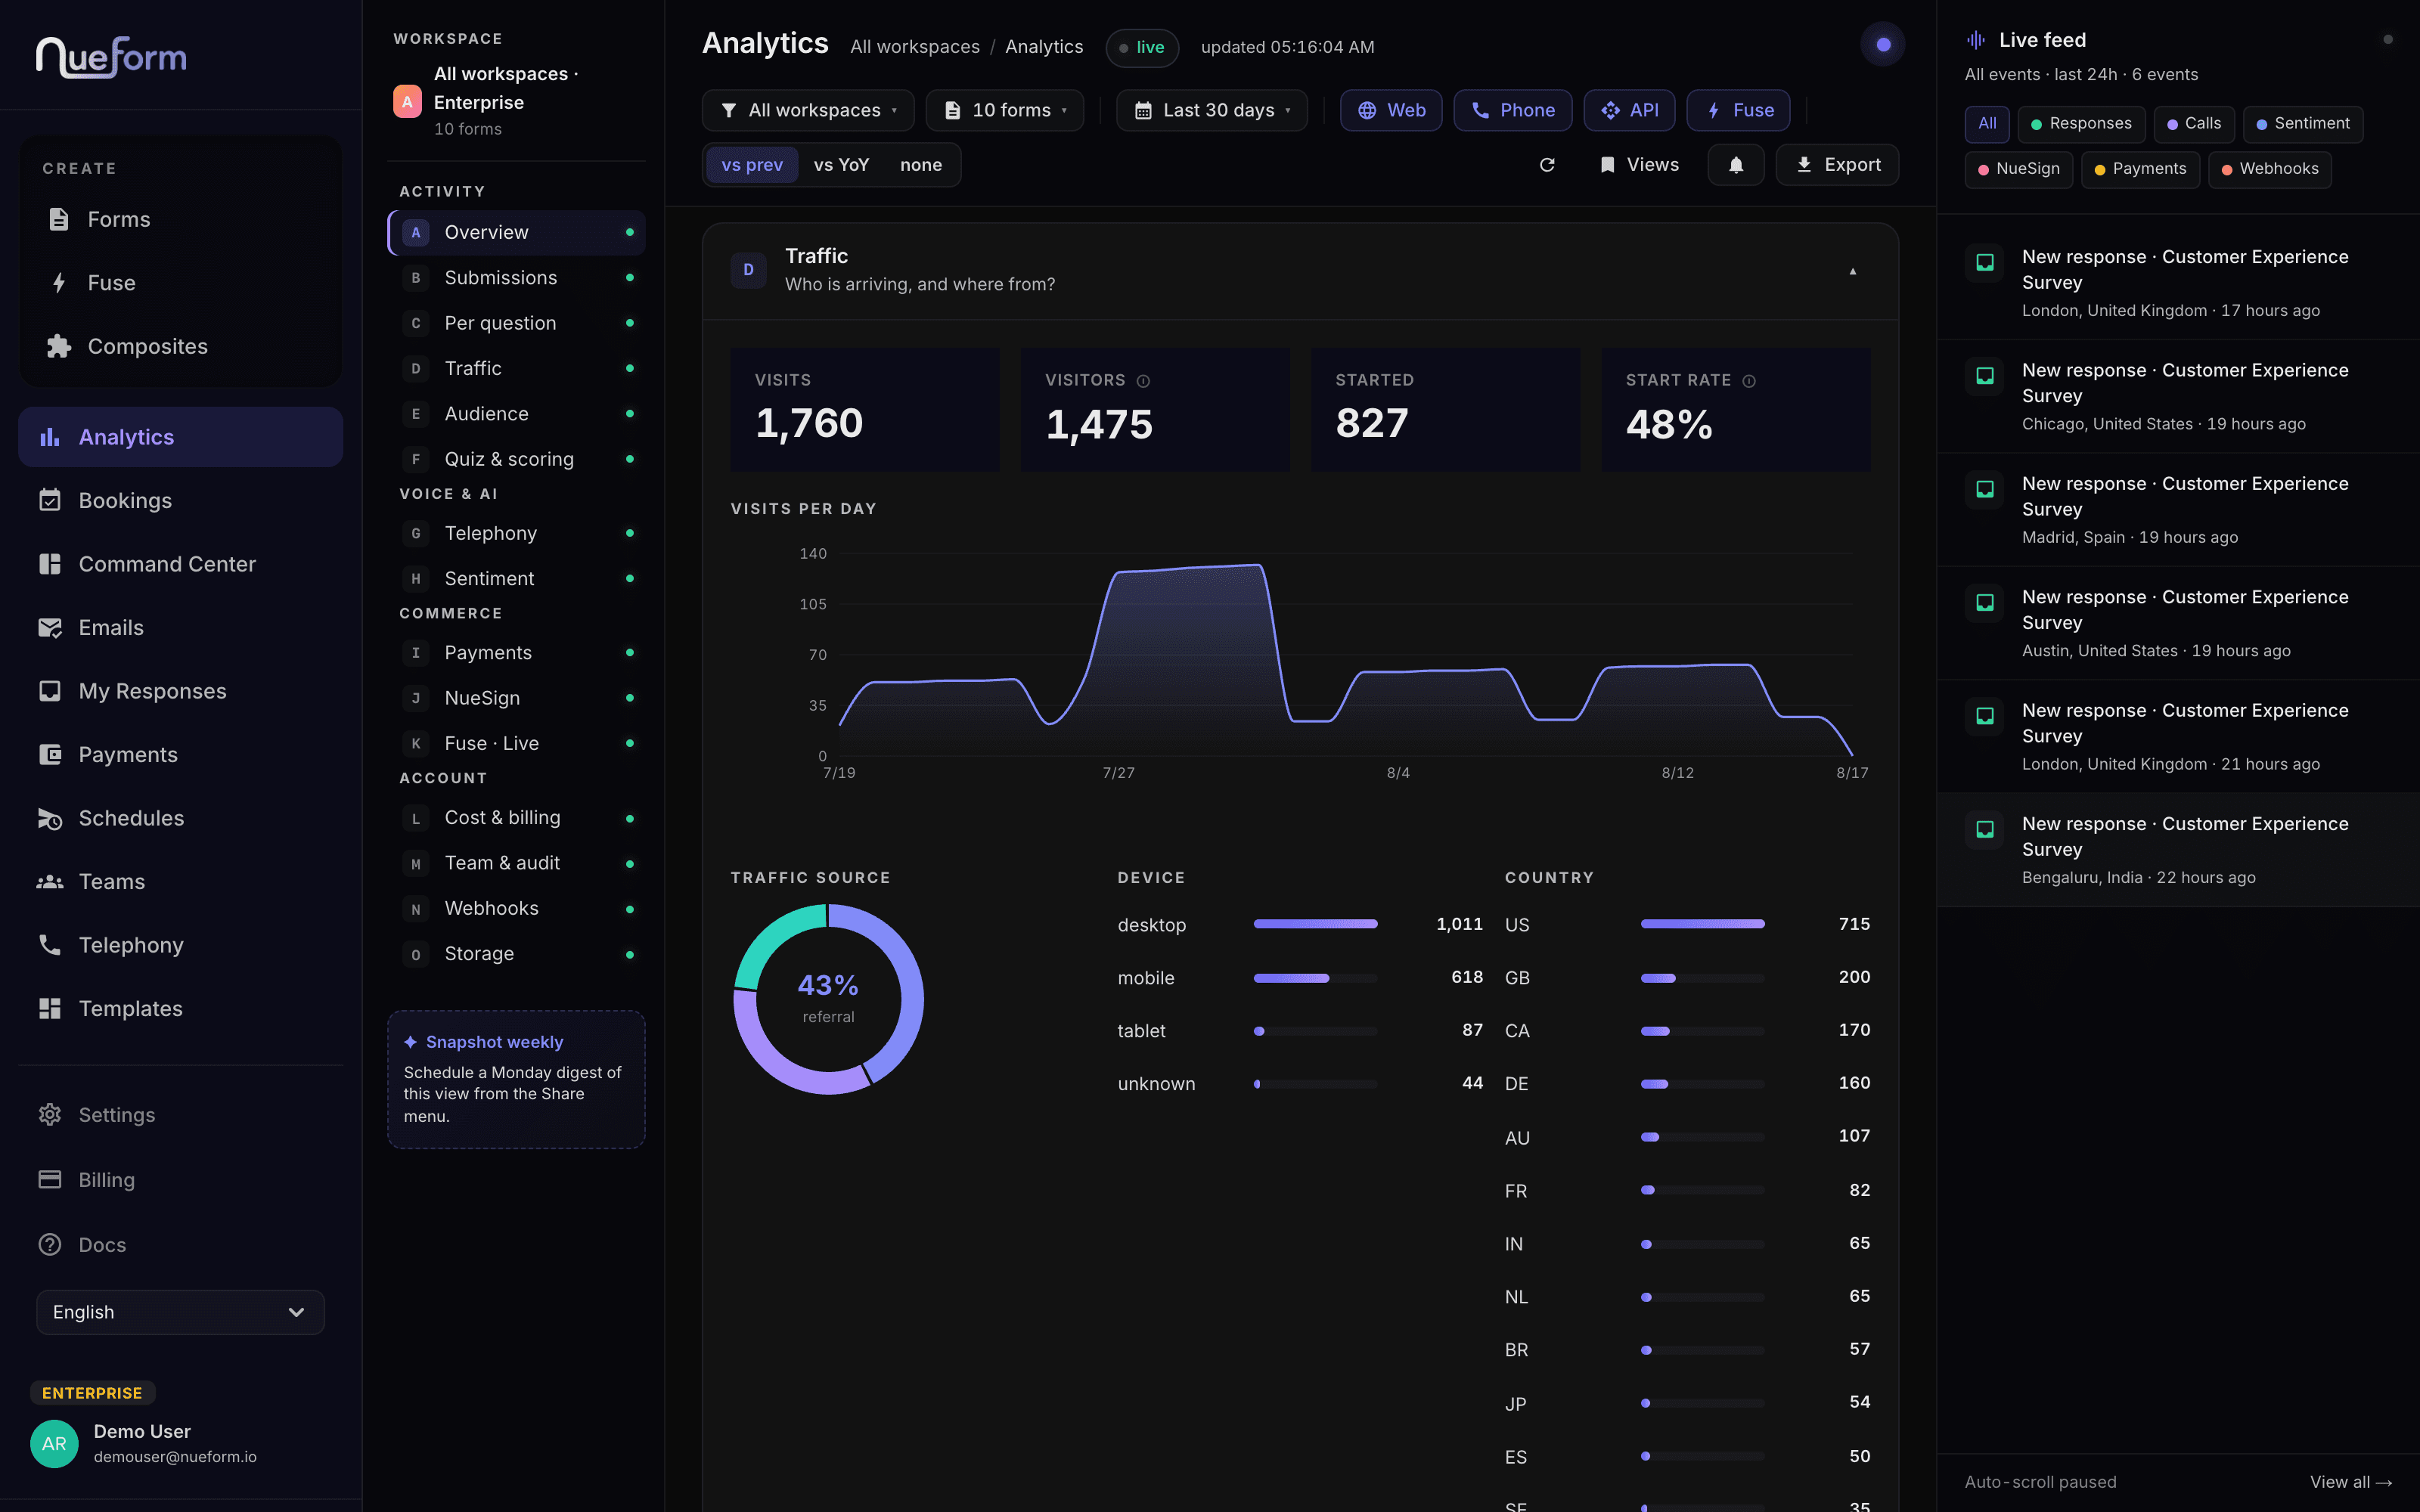
Visits over time, a visit → start → submit funnel, unique visitors and average time on form. Set any window you like; the numbers under it are counted, not sampled — and a rate we cannot compute honestly shows a dash rather than a flattering zero.
Where they came from, down to the referrer
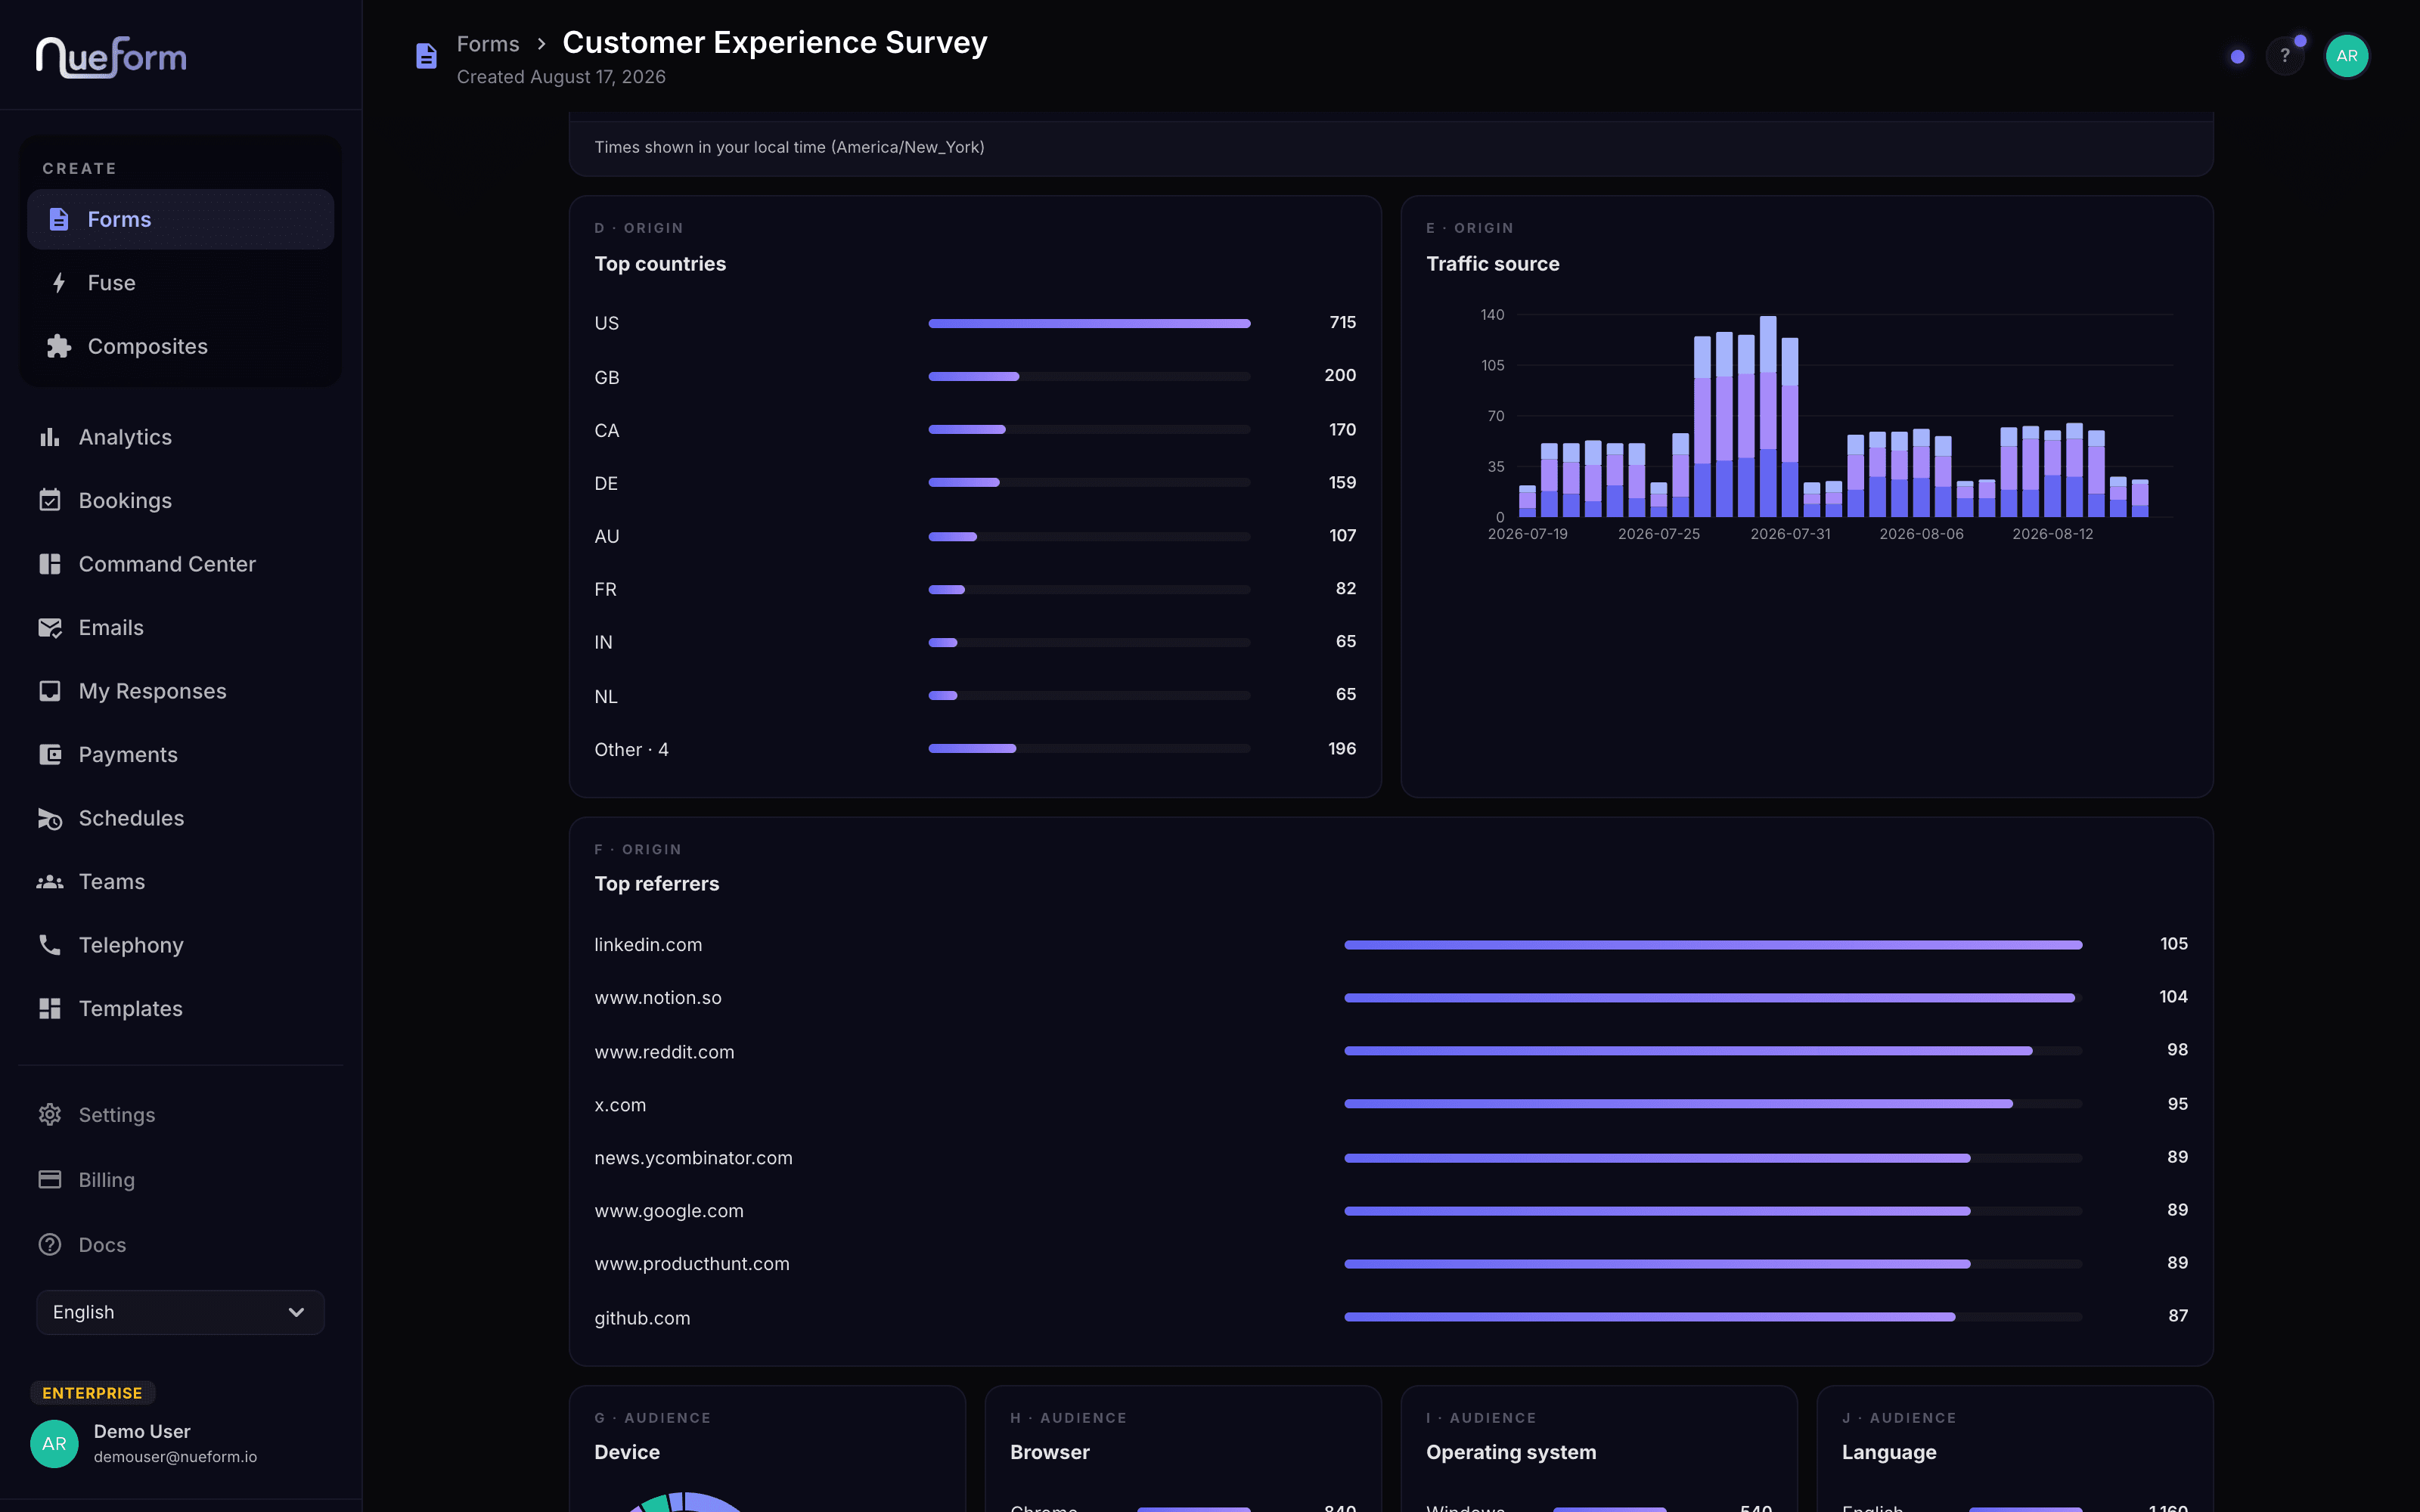
Country, traffic source and the actual hosts sending you people — with a real "Other" roll-up instead of a silently truncated tail. Campaign parameters ride along, so the link you posted on Monday is still attributable on Friday.
The exact step where people stop
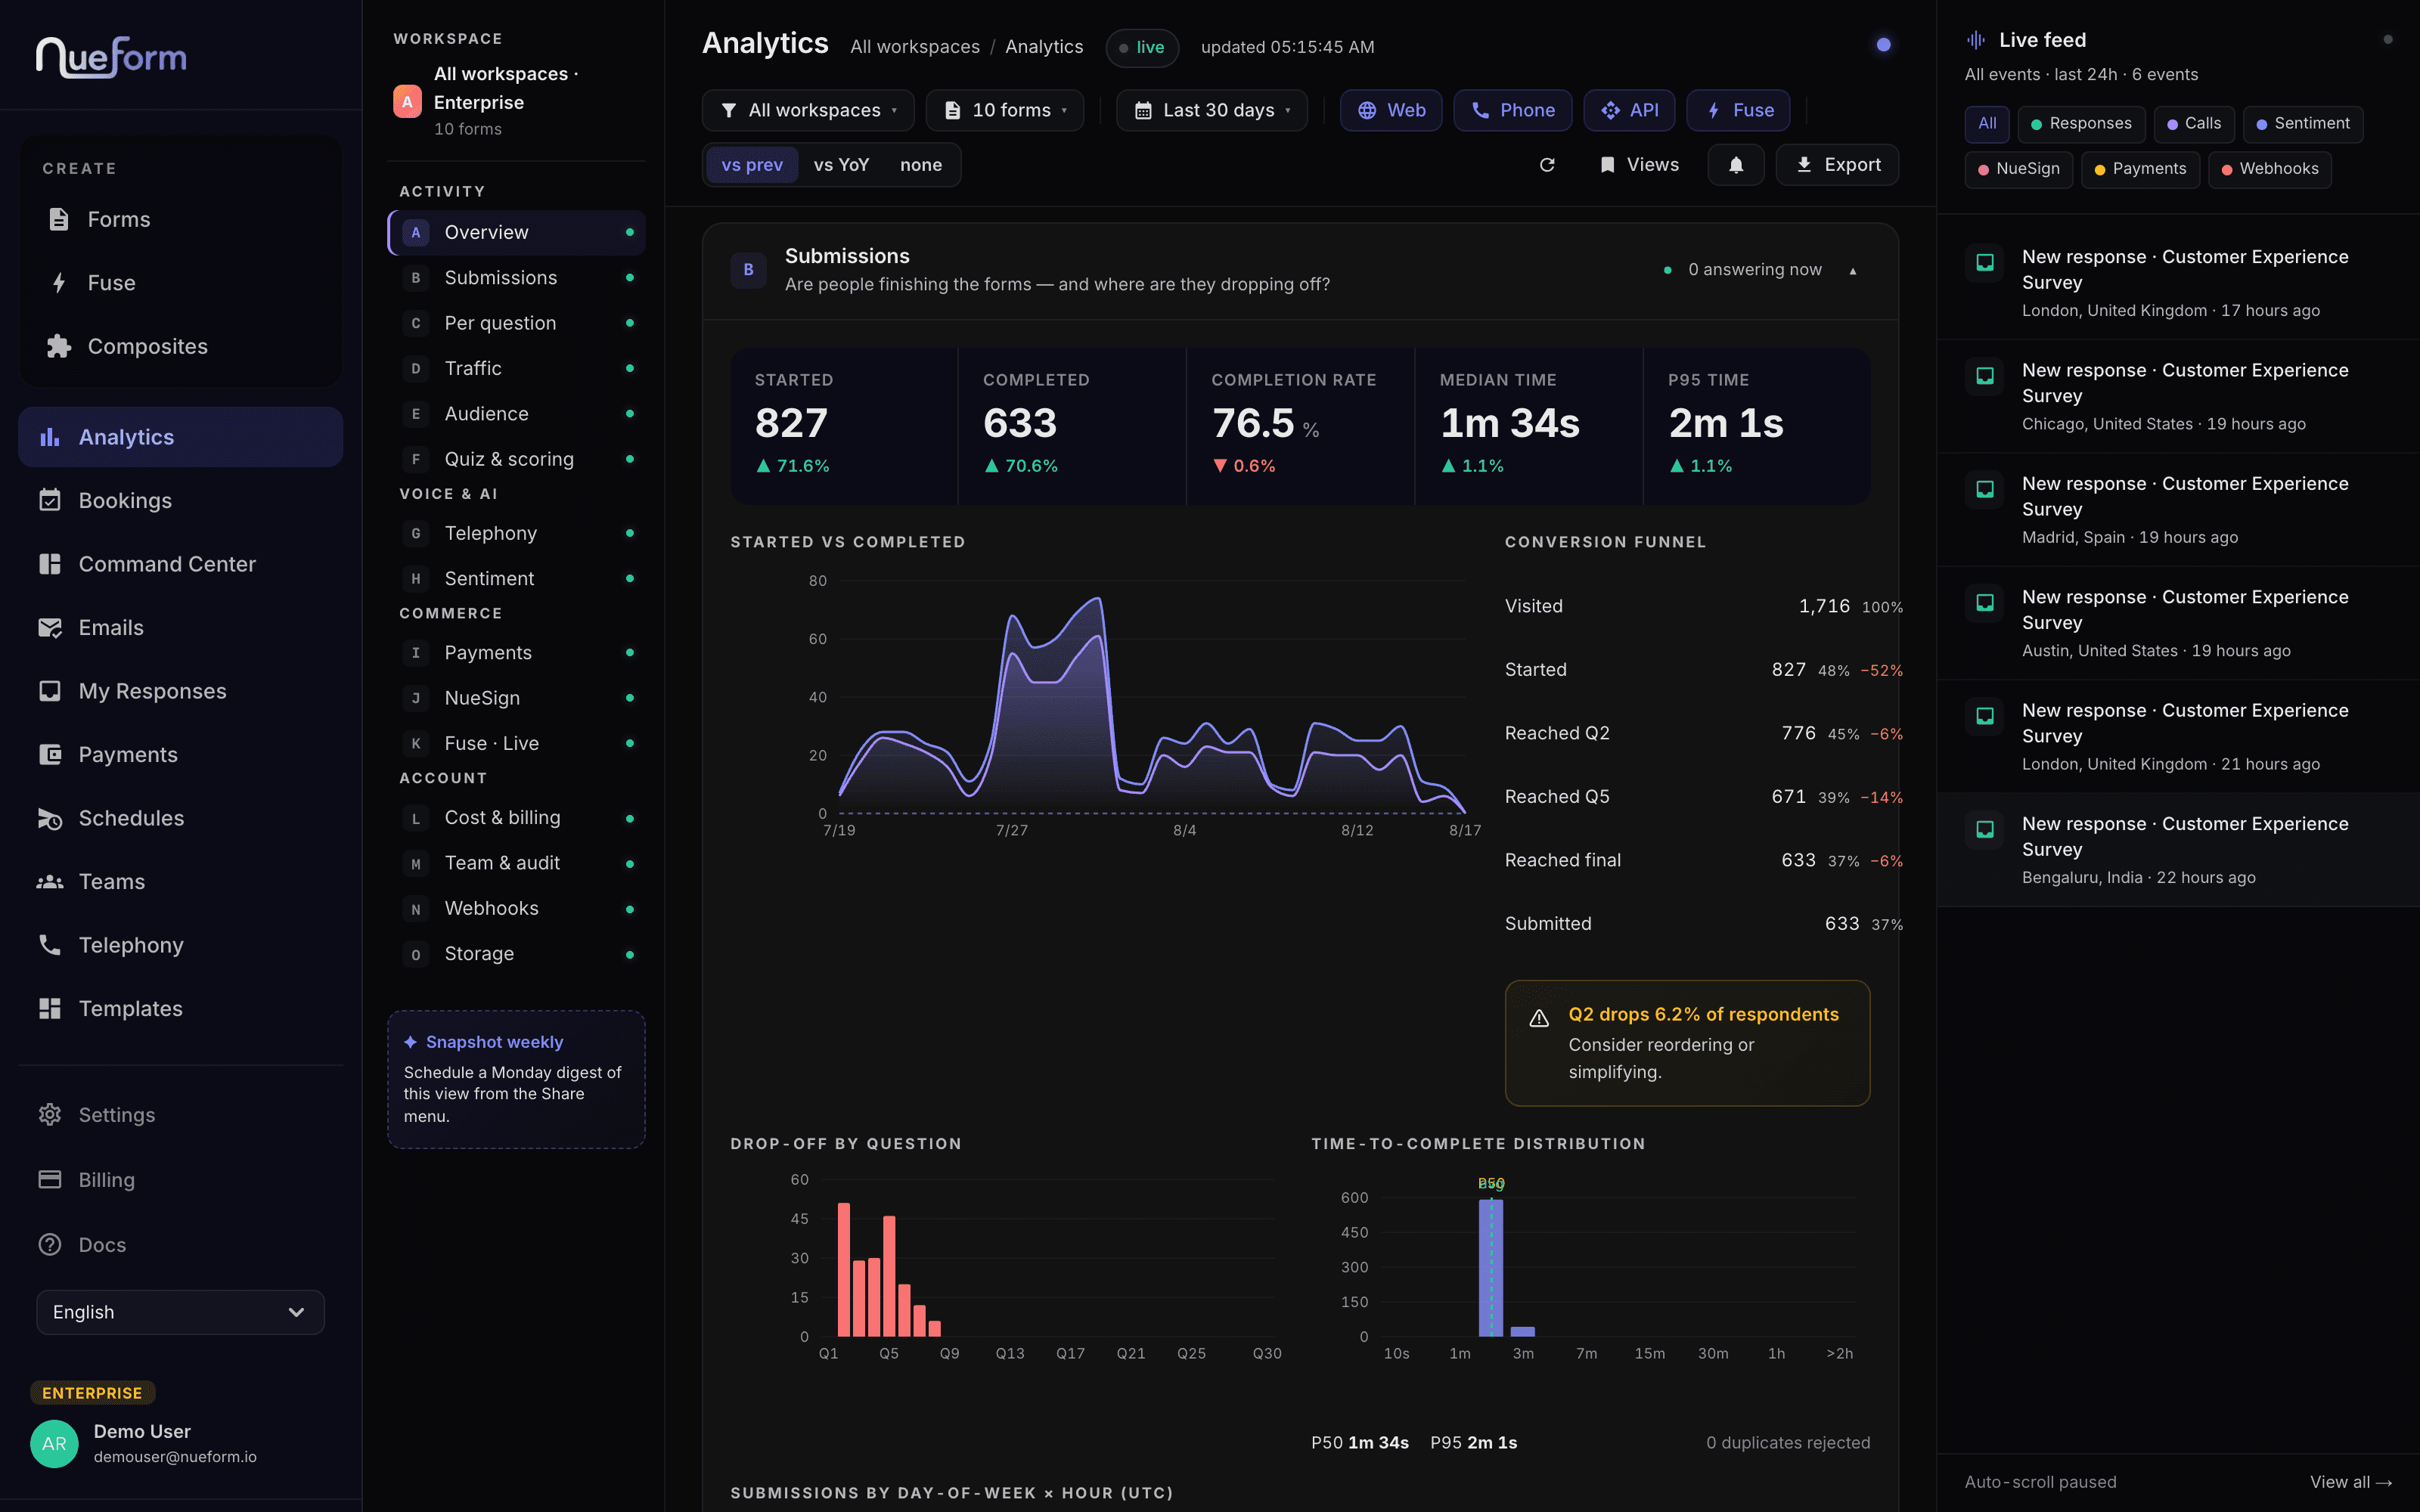
Visited → started → reached question five → submitted, each with its count and its share of the whole. The biggest fall is the one worth fixing, and it is almost never where you would have guessed.
The visitor behind a single answer
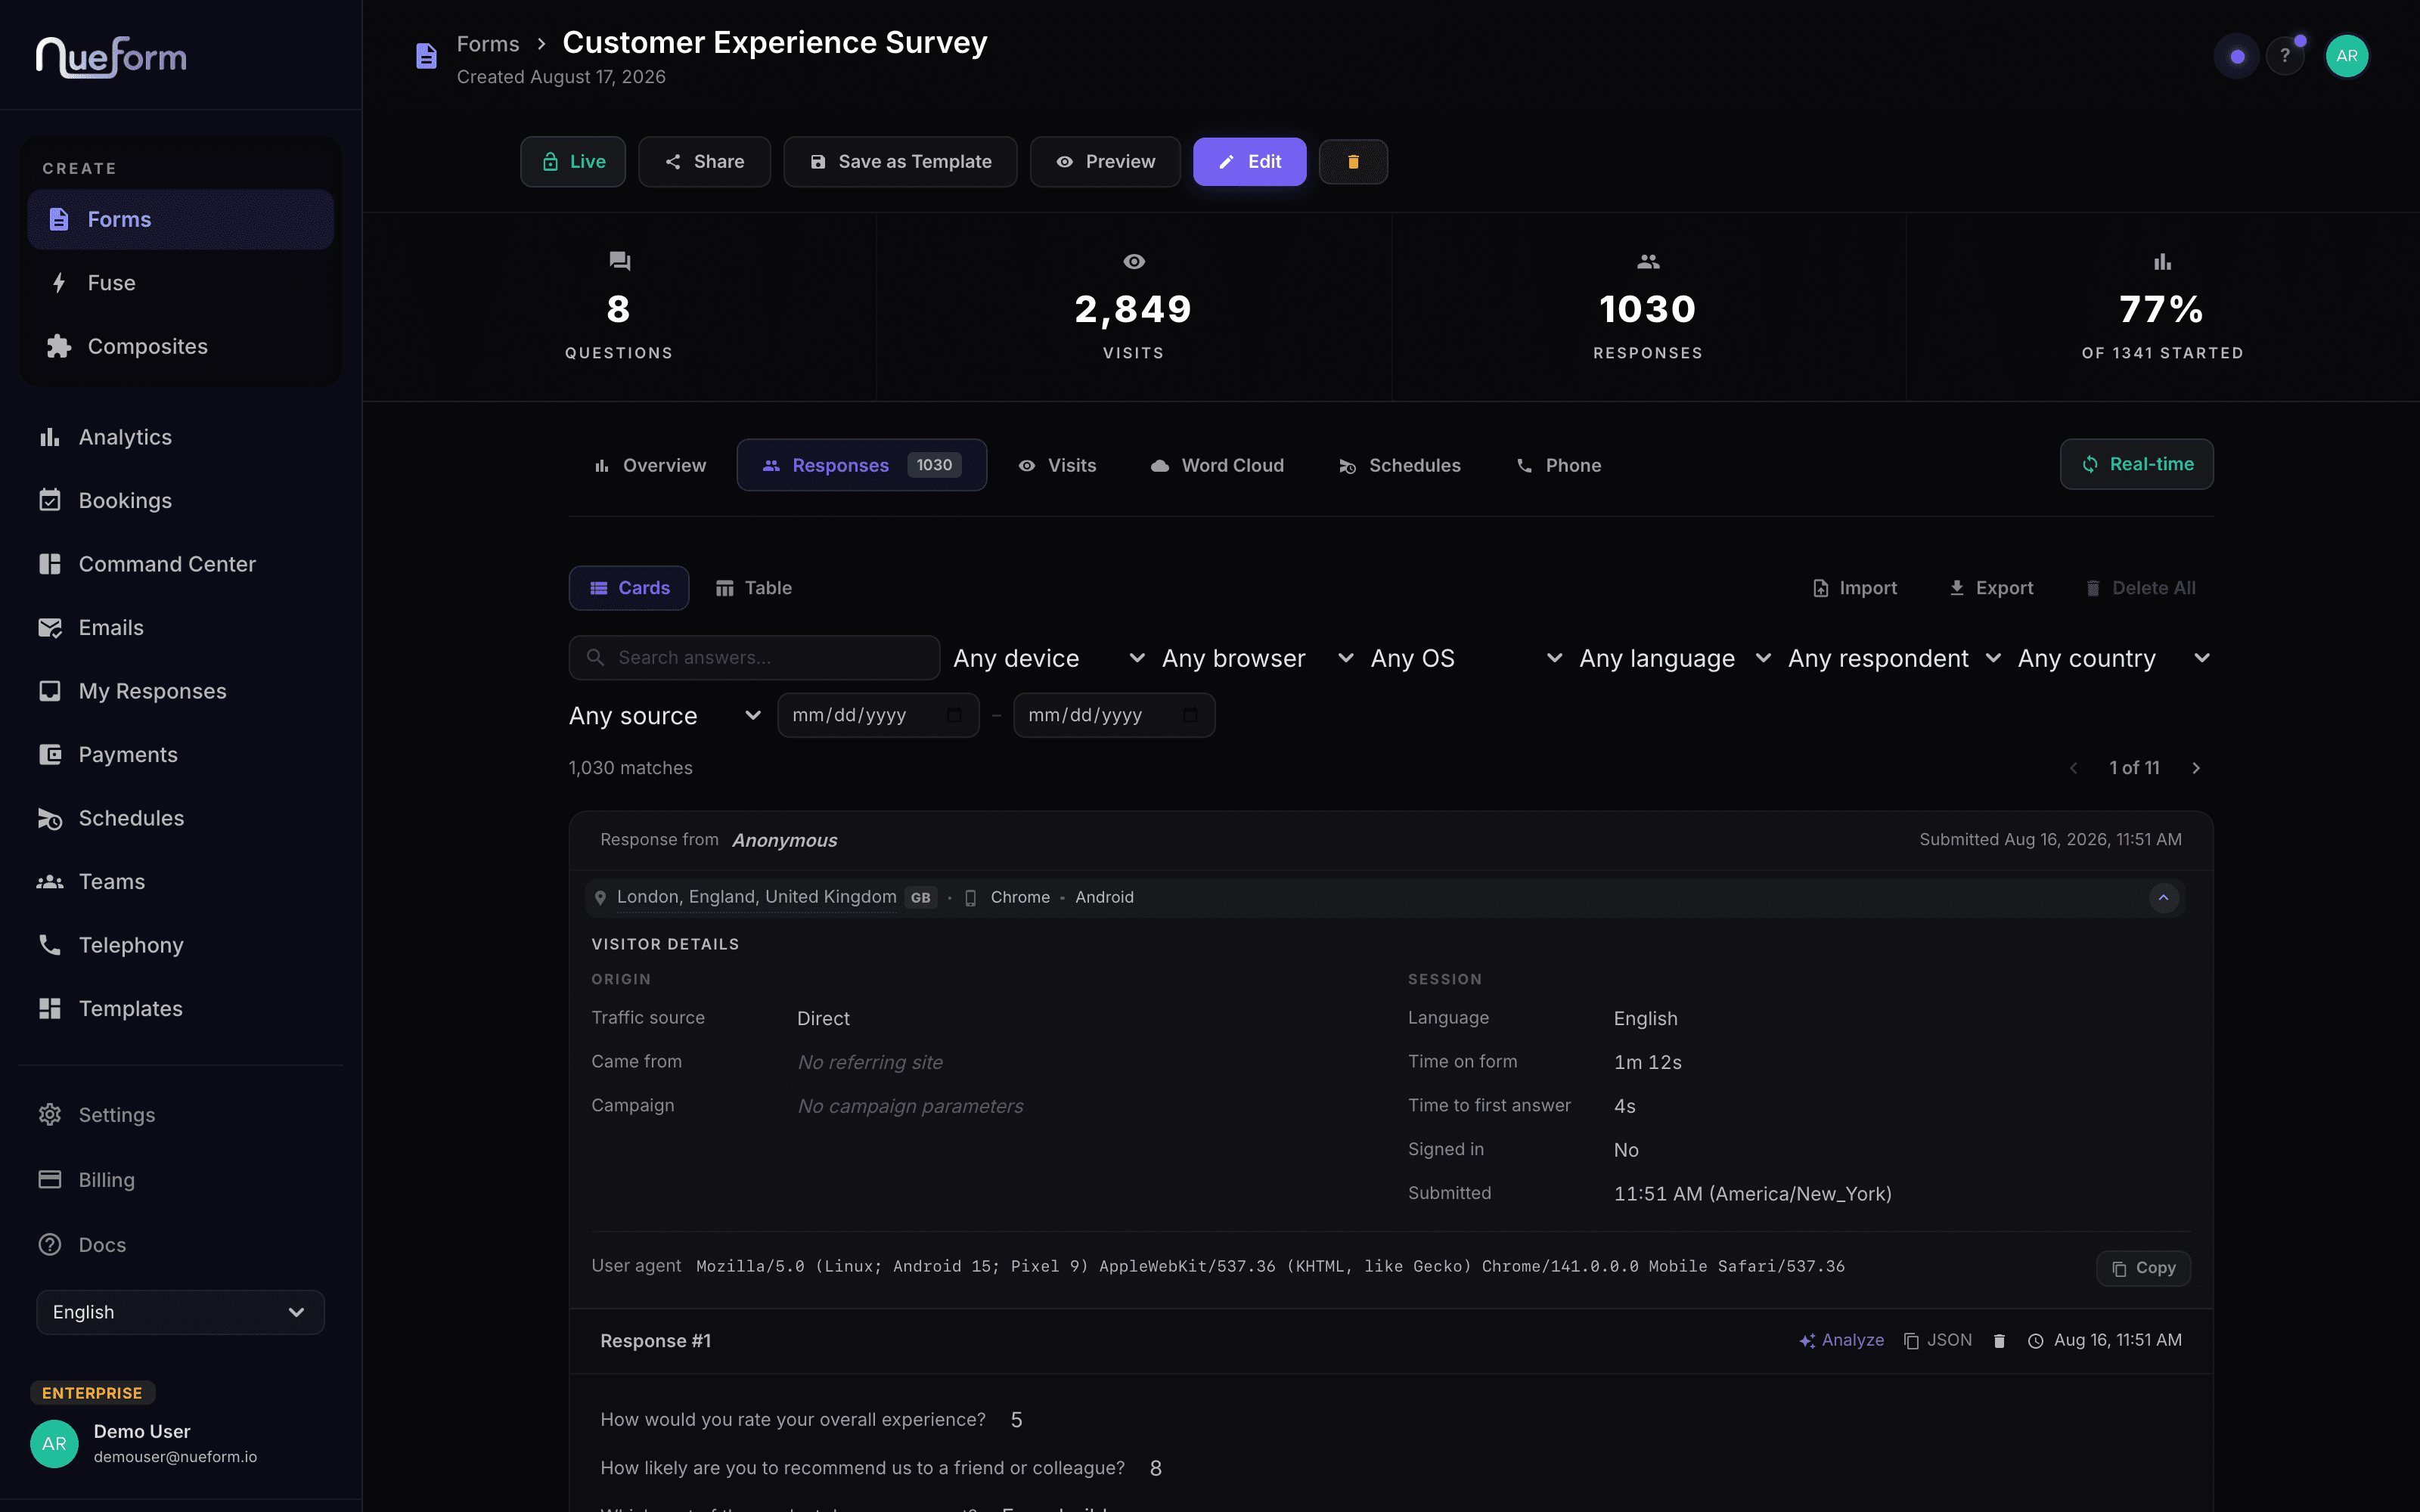
Open any response and the traffic story is attached to it: the source, the referring site, the campaign, their language, how long they spent and how long before the first answer. The full user agent is there when you need it — and never an IP address, because no response row stores one.
The whole operation on one screen
Response radar, question-timing cloud, a world map of incoming responses, velocity vector and aggregate system metrics. Built to be left running on a wall display, and it updates itself.
Fifteen sections, one scroll
Every form you own in a single workspace: submissions, per-question, traffic, audience, quiz scoring, telephony, sentiment, payments, contracts, webhooks, storage and billing. Date ranges, period-over-period comparison, and an XLSX of all of it.
It moves while you are watching it
Open a dashboard and leave it on the second monitor. A visit lands and the counter moves. A response lands and the funnel redraws, the map drops a pin, the feed scrolls. No refresh, no polling interval, no nightly job — the page is subscribed to the form.
Every screenshot on this page is a live surface. None of them are waiting on a batch.
Make the form better
Every number here points at a decision. Not a dashboard to admire — a list of things to change.
- ·Visit-to-start rate tells you whether the problem is your traffic or your first question
- ·Drop-off by question tells you which one to cut, shorten or move
- ·Device and time-of-day tell you when and how to promote it
Find your people
Who is actually engaging, and from where — across every form, team and channel you run.
- ·Geography and language, down to the country your traffic really comes from
- ·Team analytics, so you can see which forms are carrying the workspace
- ·Search every answer anyone has ever given, across thousands of responses
Three questions you can finally answer
Not metrics to admire. Decisions you can act on Monday morning.
Which question is costing me responses?
Sort by median time and by drop-off. The question that takes thirty-nine seconds when the rest take five is the one to cut, split or move — and you can watch the completion rate recover after you do.
Per-question · Activity workspace
Where do my best respondents come from?
Volume and quality are different things. Break arrivals down by source, referrer, campaign and country, then compare start and submit rates across them. The channel that sends the most people is very often not the one that sends the right ones.
Traffic · Visits tab
Is it my form, or is it my traffic?
The most expensive week you can spend is rewriting a form that was never the problem. Visits, starts and submissions on one chart separate the two in about four seconds — fewer arrivals is a marketing problem, a falling rate is a form problem.
Visit → start → submit funnel
You don't have to set any of this up
It's already on
No script to install, no tag manager, no second analytics account, nothing to configure. Publish a form and it is being measured — the first visit lands before you have finished sharing the link.
Nothing is sampled
Every figure is counted from rows, at any volume. No thresholds, no estimates, no "based on a subset of your sessions", and no row cap quietly deciding what your numbers are made of.
Included on every plan
From the first form you publish. There is no analytics add-on, no per-event pricing, and no seat you have to buy to look at your own traffic.
Stop guessing why people didn't finish
Visit tracking is on for every plan, from the first form you publish.